
Quarterly civil aviation statistics, fourth quarter 2025
Released: 2026-09-22

Highlights
Operating revenue for the 23 largest Canadian air carriers totalled $9.0 billion in the fourth quarter, up 3.4% compared with the same quarter of 2024.
At $7.6 billion, passenger revenue was the main revenue source for airlines in the fourth quarter of 2025, while air cargo generated $684.2 million in revenue.
On an annual basis, these major Canadian air carriers earned $35.9 billion in operating revenue in 2025, an increase of 1.9% from 2024.
Operating revenue gains altitude
During the fourth quarter, operating revenue for the 23 largest Canadian air carriers (Levels I and II) totalled $9.0 billion, a 3.4% increase over the level reported in the fourth quarter of 2024.
At $7.6 billion, passenger revenue represented 85.1% of total operating revenue in the fourth quarter of 2025, while cargo revenue, accounting for 7.6% of total operating revenue, stood at $684.2 million.
Chart 1

Quarterly goods revenue, Canadian air carriers

On the other side of the ledger, total operating expenses were $8.8 billion in the fourth quarter, 1.1% higher than in the fourth quarter of 2024.
Chart 2
Operating revenue and expenses, Canadian air carriers

Other operating expenses (53.2%), such as depreciation and maintenance, accounted for the largest share of total operating expenses in the fourth quarter, followed by wages, salaries and benefits (24.2%) and turbo fuel (22.6%). Canadian Level I and II air carriers spent $2.0 billion to purchase turbo fuel and paid $2.1 billion in wages, salaries and benefits to their 74,996 employees. This was the first year-over-year increase in fuel expenses (+4.4%) since the third quarter of 2024.
In the fourth quarter, wages, salaries and benefits increased by 6.4% year over year while operating revenue per employee was down 1.2% to $123,155. Furthermore, the level of labour productivity, as measured by total tonne-kilometres flown per employee, decreased by 1.9% from the fourth quarter of 2024 to 89.4 tonne-kilometres.
Transborder passenger counts lag while other sectors continue ascending
The 23 largest Canadian air carriers transported 21.9 million passengers in the fourth quarter of 2025—21.5 million on scheduled flights and 438,000 on chartered flights. This represented an increase of 0.4% from the same quarter in 2024.
In the fourth quarter of 2025, there were 10.8 million passengers on domestic routes, up 2.4% year over year, and 11.1 million passengers on international routes (-1.5%). Among the international passengers, 4.4 million (-15.3%) had taken transborder flights (between Canada and the United States) and 6.7 million (+10.3%) were carried on other international flights.
Chart 3
Passengers carried, by sector, quarterly data, Canadian air carriers

Scheduled (non-charter) traffic was 55.9 billion passenger-kilometres in the fourth quarter, while capacity was 69.2 billion available seat-kilometres, resulting in a load factor of 80.7%. This was slightly below the load factor from the same quarter in 2024 (81.3%).
Chart 4
Passenger load factor, Canadian air carriers

2025: A year of navigating transborder turbulence
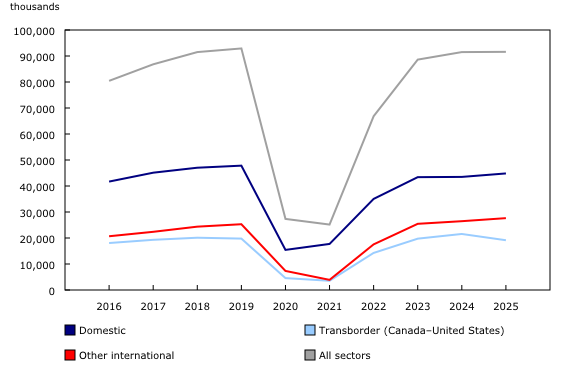
In 2025, the 23 largest Canadian carriers transported 91.6 million passengers, an increase of 0.1% from the 91.5 million passengers carried in 2024. Domestic traffic rose 3.1% from 43.5 million passengers in 2024 to 44.8 million. International traffic decreased 2.6% year over year to 46.8 million passengers in 2025. This was driven by a significant decrease in transborder passengers (-11.2%), partially offset by an increase in other international passengers (+4.4%). The decline in transborder traffic coincided with an abrupt shift in Canadian travel sentiment towards the United States as trade tensions intensified in early 2025. This marks the third consecutive year that the 23 major Canadian carriers flew more passengers on international flights than on domestic ones.
Chart 5
Passengers carried, by sector, annual data, Canadian air carriers
Operating revenue earned in 2025 totalled $35.9 billion, 1.9% higher than in 2024, while total operating expenses rose by 5.0% to $35.1 billion for the same period.
Chart 6
Annual operating revenue and expenses, Canadian air carriers

While overall passenger counts were relatively unchanged from 2024, the increasing share of passengers flying on international routes (other than to the United States) was reflected in other measures. On scheduled transborder flights, the passenger load factor (the ratio of passenger-kilometres to available seat-kilometres) declined from 83.7% in 2024 to 78.3% in 2025, while the other international passenger load factor increased from 85.9% to 86.4%. Each passenger travelled an average of 2,666 kilometres in 2025, 0.9% above the previous year (2,642 kilometres). At 2.7 million hours, total hours flown were 3.9% higher than those reported in 2024. Total traffic reached 244.3 billion passenger-kilometres in 2025, 1.0% higher than in 2024.
Note to readers
Coming in for a landing—please note that the release for the fourth quarter of 2025 will be the last data release for the Quarterly Civil Aviation Survey. Financial and operating statistics for the Aviation industry will continue to be available from the Annual Civil Aviation Survey. To learn how the agency is adapting to continue delivering quality data that Canadians rely on, visit Delivering trusted data through change.
This release covers Canadian Level I and II air carriers. As of June 2025, Sunwing Airlines was fully integrated into WestJet, decreasing the number of air carriers to 23 in the third quarter of 2025.
In 2024, Level I and II carriers accounted for 93.0% of the total operating revenue as published in Civil aviation financial statistics, Canadian air carriers, Levels I to III, annual. Final estimates for the 2025 annual civil aviation statistics will be available in early 2027.
Level I air carriers include every Canadian air carrier that, in the calendar year before the year in which information is provided, transported at least 2 million revenue passengers or at least 400 000 tonnes of cargo.
Level II air carriers include every Canadian air carrier that, in the calendar year before the year in which information is provided, transported (a) at least 100,000, but fewer than 2 million, revenue passengers, or (b) at least 50 000 tonnes, but fewer than 400 000 tonnes, of cargo.
Net non-operating income and loss are from commercial ventures that are not part of the air transportation services, from other revenues and expenses attributable to financing or other activities that are not an integral part of air transportation, and from special recurrent items of a non-periodic nature. Provision for income taxes is also included. Non-operating income can be, for example, capital gains from the sale of aircraft, interest income and foreign exchange adjustment, while non-operating expenses can include capital losses and interest on bank loans and other debt.
Data in this release are not seasonally adjusted.
Survey data are revised on a quarterly basis to reflect new information.
Because of rounding, components may not add up to the total.
Contact information
For more information, or to enquire about the concepts, methods or data quality of this release, contact us (toll-free 1-800-263-1136; 514-283-8300; infostats@statcan.gc.ca) or Media Relations (statcan.mediahotline-ligneinfomedias.statcan@statcan.gc.ca).
- Date modified: