 |
All
releases > Profiles of Canadian farm operators
>
Who’s minding Ontario’s farms?
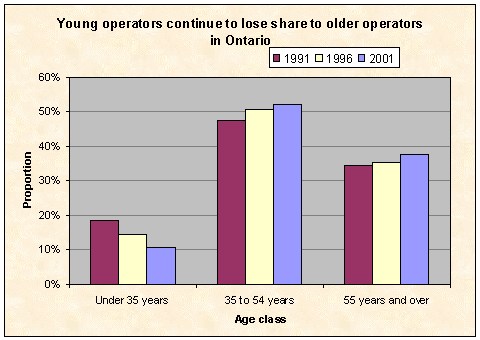
Distribution of farm operators in Ontario by age
class, 1991 to 2001
Other highlights
The number of farm operators in Ontario declined 12.3%, from 96,940
in 1996 to 85,020 in 2001. This was the largest absolute decline in farm
operators across the nation. The decrease in farm operators is similar
to the 11.5% decline in the number of farms reported on May 15, 2002 in
Farm operations:
regional trends.
Dividing the farm operator population into three age categories —
under 35 years, 35 to 54 and 55 and over — shows clear trends. Although
all three have declined in number since the last census, the change in
the youngest group (which includes operators from 15 years of age to 34)
is dramatic and casts an increasingly large and grey shadow over farming’s
future. From 1996 to 2001 the number of operators under 35 decreased by
35.1%. Since 1991, operators in this group dropped by more than 50%.
Another way to look at the whole picture is to consider the shares held
by each age group. As the share of the youngest group shrinks from census
to census, the two older groups tend to increase: in 2001, nearly 52%
were between the ages of 35 and 54 and those 55 and over represented 37.5%.
The youngest group now represents 10.6% of all farmers; 10 years ago it
was 18.3%. Whether the picture is viewed in absolute or relative terms,
farm operators are a greying population.
A comparable group of self-employed workers under 35 in the general labour
force constitutes 19.6% of all self-employed workers in Ontario. This
is a stark difference from the 10.6% of farm operators under 35.
Distribution of farm operators in Ontario by age class,
1991 to 2001
| |
1991 |
1996 |
2001 |
% change 1991 to 2001 |
% change 1996 to 2001 |
| |
Number |
Proportion
(%) |
Number |
Proportion
(%) |
Number |
Proportion
(%)
|
|
Under 35 years |
18,435 |
18.3 |
13,840 |
14.3 |
8,980 |
10.6 |
-51.3 |
-35.1 |
35 to 54 years |
48,005 |
47.6 |
48,995 |
50.5 |
44,150 |
51.9 |
-8.0 |
-9.9 |
55 years and over |
34,465 |
34.2 |
34,105 |
35.2 |
31,890 |
37.5 |
-7.5 |
-6.5 |
Total operators |
100,905 |
100.0 |
96,940 |
100.0 |
85,020 |
100.0 |
-15.7 |
-12.3 |
A further indication of an aging farm population in Ontario is the increase
in the median age of farm operators. The median age increased from 49
years in 1996 to 50 in 2001. In addition, of all the farm operators counted
on May 15, 2001, 16.9% were 65 or over. Another 17,540, or 20.6%, will
celebrate their 65th birthday by 2011. By contrast, 9.1% of the entire
labour force will turn 65 by the 2011 Census.
Additional profiles on the other provinces, and on women farm operators,
operator injuries, and on- and non-farm work are available at Profiles
of Canadian farm operators. Tables with more provincial detail about
farm operators, including their median age and sex, on- and non-farm work,
injuries, and distribution by farm type, gross farm receipts, and farm
capital are available at Canadian Statistics.
Other highlights
In 2001, 85,020 farm operators were on 59,728 farms in Ontario. Single-operator
farms accounted for 60.4% of all farms, while same-generation farms
accounted for 31.9%, and multiple-generation farms made up the remaining
7.6%. (Operators must have at least 20 years difference in age but not
necessarily be related to be considered of a different generation.) The proportion of female farm operators in Ontario stayed the same
between 1996 and 2001, at 27% of all farm operators. Ontario has the
third largest proportion of female operators in Canada. Only British
Columbia (36.2%) and Alberta (28.4%) have larger female proportions.
The national proportion of female operators is 26.3%. In Ontario, women under 35 were the only age group of female operators
to decrease in proportion since the last census, dropping to 10.5% in
2001 from 15.1% in 1996. In 2001, the median age of male operators in Ontario was 50 years,
an increase of one year from 1996. The median age for female operators moved to 48 from 47 in 1996. Nationally,
the median age for male operators was 49 and 48 for female operators
in 2001. In the last 12 months before the census, 2,310 farm operators in Ontario
— or 2.7% — suffered a farm-related injury requiring medical attention
or resulting in lost time. Ontario, along with New Brunswick, had the
second lowest injury rate in Canada. Only Newfoundland and Labrador
had a lower rate of injury (1.9%). The national injury rate was 3.2%. The most common injuries suffered by Ontario farm operators were fractures
(21.9%), open wounds (20.4%) and nerve and spinal cord injuries (14.5%). The proportion of farm operators in Ontario working more than 40 hours
per week on the farm decreased 1.1% between 1995 and 2000 to 44.2%.
Ontario is below the 2000 national level of 47.7% for on-farm work greater
than 40 hours per week. In 2000, 44.5% of all female operators engaged in non-farm work in
addition to their work on the farm, compared with 45.8% of their male
counterparts. This was similar to the national level of 45.6% of female
and 44.2% of male operators with non-farm work.
The complete set of data on farm operators, including distribution by
age class, is now available at the county, municipality and regional district
levels (or their equivalents) in Farm operator data: initial release
(95F0355XIE, free) on Statistics
Canada's Web site ().
From the Our products and services page choose Free publications
then Agriculture.
For more information, or to enquire about the concepts, methods or data
quality of this release, contact Gaye Ward (613-951-3172), Census of Agriculture,
or Media Relations (613-951-4636).
Require assistance or advice on 2001 Census of Agriculture Products and
Services? Contact the nearest Statistics
Canada Regional Reference Centre.
|



