
Labour Force Survey, September 2026
Released: 2026-10-09


Highlights
Employment declined by 68,000 (-0.3%) in September and the employment rate fell 0.2 percentage points to 60.6%. The unemployment rate increased 0.1 percentage points to 6.5%.
The employment decline was concentrated among youth aged 15 to 24 (-48,000; -1.8%) as well as women aged 25 to 54 (-28,000; -0.4%).
There were fewer people working in educational services (-35,000; -2.2%), health care and social assistance (-23,000; -0.8%) as well as manufacturing (-13,000; -0.7%). There were more people working in 'other services' (+17,000; +2.1%), which includes repair and maintenance as well as personal or household services.
Employment decreased in Quebec (-49,000; -1.1%), British Columbia (-20,000; -0.7%) and Manitoba (-4,400; -0.6%). It increased in Alberta (+23,000; +0.9%), Newfoundland and Labrador (+1,800; +0.7%), and Prince Edward Island (+1,000; +1.0%).
Average hourly wages among employees rose 2.3% (+$0.86 to $37.64) on a year-over-year basis in September, following growth of 2.0% in August (not seasonally adjusted).
Employment falls for second consecutive month
In September, employment declined by 68,000 (-0.3%), split between full-time work (-35,000; -0.2%) and part-time work (-33,000; -0.9%). The employment decline in September follows a decrease in August (-42,000; -0.2%).
Chart 1

Employment rate decreases in September

Prior to these two consecutive monthly declines, employment had trended up from April to July (+181,000; +0.9%). On a year-over-year basis, employment was up by 95,000 (+0.5%) in September.
The employment rate—the proportion of the population aged 15 and older who are employed—decreased by 0.2 percentage points to 60.6% in September, marking a second consecutive monthly decrease. On a year-over-year basis, the employment rate in September was unchanged.
Infographic 1
Employment rate by age group, September 2026

Downward trend in the number of public sector employees
In September, the number of public sector employees declined by 70,000 (-1.5%). This was the fourth consecutive monthly decline for the sector. On a year-over-year basis, the number of public sector employees was down by 119,000 (-2.6%), with most of the decline attributable to employment in educational services.
The number of private sector employees was little changed for a second consecutive month in September but it was up by 163,000 (+1.2%) compared with 12 months earlier.
Self-employment edged down in September (-23,000; -0.8%). This follows an upward trend from April to July. On a year-over-year basis, self-employment was up by 51,000 (+1.9%).
Unemployment rate increases to 6.5%
The unemployment rate rose 0.1 percentage points to 6.5% in September. Earlier in the year, it reached a recent peak of 6.9% in April, before declining to 6.4% in July and August. The unemployment rate in September was the same as it was at the start of the year (6.5% in January).
Chart 2
Unemployment rate rises to 6.5% in September

Infographic 2
Unemployment rate by age group, September 2026

The layoff rate—representing the proportion of people who were employed in August but had become unemployed in September as a result of a layoff—was 0.7%, similar to the rate observed a year earlier (0.6%) and the average during the period from 2017 to 2019 (0.6%) (not seasonally adjusted).
The job-finding rate was 30.6% in September, down from 32.8% 12 months earlier and below the average of 36.5% during the period from 2017 to 2019. This refers to the proportion of people who were unemployed in August and had found a job in September.
The labour force participation rate—the proportion of the population aged 15 and older who were employed or looking for work—fell 0.2 percentage points to 64.8% in September. This was the lowest level since December 1997 (when it was also 64.8%), excluding 2020 during the COVID-19 pandemic. On a year-over-year basis, the participation rate was down 0.4 percentage points in September 2026, largely the result of population aging (See text box: The impact of population aging on the declining participation rate).
The impact of population aging on the declining participation rate
The Canadian population is aging and is projected to continue to exert downward pressure on labour supply in the coming years (See: The labour force in Canada and its regions: Projections to 2036; The impact of aging on labour market participation rates). While older Canadians are participating in the labour market at higher rates relative to previous cohorts, there is nonetheless a drop-off in participation rates at older ages, especially for those aged 65 and older.
In September 2026, people aged 65 and older accounted for 23.2% of the working-age population (i.e., those aged 15 and older) in the Labour Force Survey, up from 20.5% in September 2019, prior to the COVID-19 pandemic (see Chart 3). In comparison, this share was 14.8% at the turn of the millennium.
The upward trend in the share of people aged 65 and older in the working-age population was briefly paused in 2023 and 2024, as sharp increases in permanent and temporary immigration offset the aging of the population. However, in 2025 and into 2026, the trend towards an aging population resumed.
The lower labour force participation rate observed in September 2026, relative to a year earlier and to the pre-pandemic period, can largely be attributed to population aging. Using a method that holds constant the September 2019 age composition of the population, the participation rate in September 2026 would be little changed (-0.1 percentage points) year over year and would be 0.2 percentage points higher than in September 2019 (see Chart 4).
Chart 3
Proportion of people aged 65 and older in the working-age population
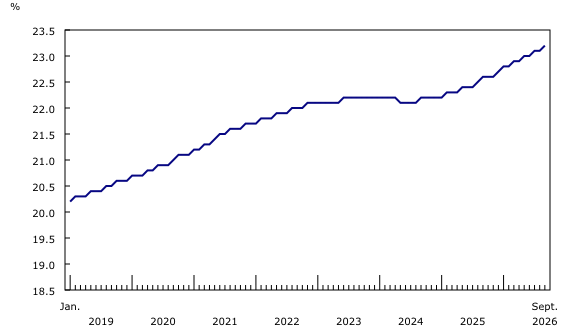
Chart 4
Labour force participation rate, holding the age composition constant to September 2019

Youth employment declines
Employment among youth aged 15 to 24 fell (-48,000; -1.8%) for a second consecutive month in September. The cumulative decline over this two-month period (-67,000; -2.4%) offset gains recorded earlier from April to July. The employment decline in September was accompanied by a decline in the number of youth in the labour force (-50,000; -1.6%), and the youth unemployment rate was little changed at 13.0%.
Unemployment rate up for core-aged women
Among core-aged women (25 to 54 years old), the unemployment rate rose 0.3 percentage points to 5.3% in September, as employment fell (-28,000; -0.4%) and the number of women in this age group searching for work increased (+18,000; +4.9%). Despite the monthly increase, the unemployment rate for core-aged women in September was 0.5 percentage points lower than a year earlier and 0.6 percentage points below a recent peak of 5.9% in April.
Among core-aged men, employment held steady in September while the number of men in this age group searching for work edged down. As a result, the unemployment rate for core-aged men fell 0.2 percentage points to 5.8% in the month. Compared with the same month last year, the unemployment rate for core-aged men was down 0.3 percentage points in September.
The unemployment rate among people aged 55 and older rose 0.2 percentage points to 5.3% in September, as more people in this age group looked for work. On a year-over-year basis, the unemployment rate for this group was little changed in September.
Fewer people working in educational services, health care and social assistance as well as manufacturing
Employment in educational services fell by 35,000 (-2.2%) in September, following seven consecutive months of little change. Compared with September 2025, employment in educational services was down by 67,000 (-4.2%). The year-over-year decrease was concentrated in Quebec (-27,000; -7.0%), Ontario (-19,000; -3.2%) and Alberta (-17,000; -9.0%).
Chart 5
Employment change by industry, September 2026

Employment in health care and social assistance fell by 23,000 (-0.8%) in September, the first monthly decrease since December 2022. Despite the decline, employment in health care and social assistance was up by 93,000 (+3.2%) in the 12 months to September and was the largest contributor to overall employment growth over that period.
In September, employment also fell in manufacturing (-13,000; -0.7%), following an increase of 22,000 (+1.2%) in August. Employment in manufacturing was little changed in September compared with 12 months earlier.
Meanwhile, employment in 'other services' increased by 17,000 (+2.1%) in September and was up by 32,000 (+4.1%) compared with September 2025. This industry includes repair and maintenance as well as personal or household services.
Employment declines in Quebec and British Columbia, increases in Alberta
Employment in Quebec fell by 49,000 (-1.1%) in September, following a decrease of 19,000 (-0.4%) in August. Employment in the province has trended down since the start of the year, with a cumulative decline of 130,000 (-2.8%) from January to September. The unemployment rate in Quebec was 6.0% in September, up 0.4 percentage points in the month and up 0.8 percentage points from January.
Map 1
Unemployment rate by province and territory, September 2026

In British Columbia, employment fell by 20,000 (-0.7%) in September, marking the first monthly decrease since March for the province. The employment rate in British Columbia fell 0.4 percentage points to 60.5% while the unemployment rate was little changed at 6.4%.
Employment in Ontario edged down (-20,000; -0.2%) in September but was up by 86,000 (+1.1%) compared with 12 months earlier. The unemployment rate in Ontario was little changed at 7.0% in September but was down 0.9 percentage points from 12 months earlier.
On the other hand, employment in Alberta rose by 23,000 (+0.9%) in September and was up by 76,000 (+2.9%) compared with a year earlier. The unemployment rate in the province was 6.4% in September, down both in the month (-0.4 percentage points) and on a year-over-year basis (-1.3 percentage points).
Sustainable Development Goals
On January 1, 2016, the world officially began implementation of the 2030 Agenda for Sustainable Development—the United Nations' transformative plan of action that addresses urgent global challenges over the next 15 years. The plan is based on 17 specific sustainable development goals.
The Labour Force Survey is an example of how Statistics Canada supports the reporting on the Global Goals for Sustainable Development. This release will be used in helping to measure the following goals:



Note to readers
The Labour Force Survey (LFS) estimates for September reflect labour market conditions during the reference week of September 13 to 19, 2026.
The sample size of the LFS is approximately 65,000 households, representing over 100,000 respondents each month. For more information, see the Guide to the Labour Force Survey.
This analysis focuses on differences between estimates that are statistically significant at the 68% confidence level. Monthly estimates may show more sampling variability than trends observed over longer periods. For more information, see "Interpreting Monthly Changes in Employment from the Labour Force Survey."
LFS estimates at the Canada level do not include the territories.
The LFS estimates are the first in a series of labour market indicators released by Statistics Canada, which includes indicators from programs such as the Survey of Employment, Payrolls and Hours (SEPH); Employment Insurance Statistics; and the Job Vacancy and Wage Survey. For more information on the conceptual differences between employment measures from the LFS and those from the SEPH, refer to section 8 of the Guide to the Labour Force Survey.
The employment rate is the number of employed people as a percentage of the population aged 15 years and older. The rate for a particular group (for example, youth aged 15 to 24 years) is the number employed in that group as a percentage of the population for that group.
The unemployment rate is the number of unemployed people as a percentage of the labour force (employed and unemployed).
The participation rate is the number of employed and unemployed people as a percentage of the population aged 15 years and older.
Full-time employment consists of persons who usually work 30 hours or more per week at their main or only job.
Part-time employment consists of persons who usually work less than 30 hours per week at their main or only job.
Total hours worked refers to the number of hours actually worked at the main job by the respondent during the reference week, including paid and unpaid hours. These hours reflect temporary decreases or increases in work hours (for example, hours lost due to illness, vacation, holidays or weather; or more hours worked due to overtime).
This release refers to the gender of a person. The category "men" includes men, as well as some non-binary persons. The category "women" includes women, as well as some non-binary persons. Given that the non-binary population is small, data aggregation to a two-category gender variable is necessary to protect the confidentiality of responses provided.
Seasonal adjustment
Unless otherwise stated, estimates presented in this release are seasonally adjusted, which facilitates comparisons by removing the effects of typical seasonal variations. For more information on seasonal adjustment, see Seasonally adjusted data: Concepts and interpretation.
Population totals in the Labour Force Survey
The LFS target population includes all persons aged 15 years and older whose usual place of residence is in Canada, with some exceptions (those living on reserves, full-time members of the regular Armed Forces and persons living in institutions). The target population includes temporary residents—that is, those with a valid work or study permit, their families, and refugee claimants—as well as permanent residents (landed immigrants) and the Canadian-born.
Information gathered from LFS respondents is weighted to represent the survey target population using population calibration totals. These totals are updated each month, using the most recently available information on population changes derived from Canada's official population estimates, with minor adjustments being made to reflect the LFS target population.
While the LFS population totals are generally aligned with official demographic estimates, the official estimates should be considered the official measure of population change in Canada. More information on how population totals in the LFS are calculated can be found in the article "Interpreting population totals from the Labour Force Survey."
Next release
The next release of the LFS will be on November 6, 2026. October 2026 data will reflect labour market conditions during the week of October 11 to 17.
Products
More information about the concepts and use of the Labour Force Survey is available online in the Guide to the Labour Force Survey (71-543-G).
The product "Labour Force Survey in brief: Interactive app" (14200001) is also available. This interactive visualization application provides seasonally adjusted estimates by province, gender, age group and industry.
The product "Labour Market Indicators, by province and census metropolitan area, seasonally adjusted" (71-607-X) is also available. This interactive dashboard provides customizable access to key labour market indicators.
The product "Labour Market Indicators, by province, territory and economic region, unadjusted for seasonality" (71-607-X) is also available. This dynamic web application provides access to labour market indicators for Canada, provinces, territories and economic regions.
The product "Labour market indicators, census metropolitan areas, census agglomerations and self-contained labour areas: Interactive dashboard" (71-607-X) is also available. This dashboard allows users to visually explore the estimates using an interactive map as well as time series charts and tables.
The product Labour Force Survey: Public Use Microdata File (71M0001X) is also available. This public use microdata file contains non-aggregated data for a wide variety of variables collected from the Labour Force Survey. The data have been modified to ensure that no individual or business is directly or indirectly identified. This product is for users who prefer to do their own analysis by focusing on specific subgroups in the population or by cross-classifying variables that are not in our catalogued products.
Contact information
For more information, or to enquire about the concepts, methods or data quality of this release, contact us (toll-free 1-800-263-1136; 514-283-8300; infostats@statcan.gc.ca) or Media Relations (statcan.mediahotline-ligneinfomedias.statcan@statcan.gc.ca).
- Date modified: