


|
|
| |
Information identified as archived is provided for reference, research or recordkeeping purposes. It is not subject to the Government of Canada Web Standards and has not been altered or updated since it was archived. Please "contact us" to request a format other than those available.

|

Wednesday, November 20, 2002 2001 Census of Agriculture: Profile of farm operatorsWho is minding Canada's farms? The first release from the 2001 Census of Agriculture on May 15, 2002 concluded that fewer, but larger, farms are producing more agricultural products. Today's second release shows that the job of running the farm is increasingly falling to fewer and older farmers. Still, two farm traits seem to keep some young farmers in the industry: high gross farm receipts and capital assets. Farm operators have a median age that is much higher than the comparable labour force population of self-employed workers. Moreover, the group of farmers under 35 years old poised to fill their boots is shrinking rapidly, representing only 12% of all farmers. Nearly 20% of self-employed workers in the general labour force are under 35. In the entire labour force, 40% of all workers are less than 35 years old. The number of farmers under the age of 35 has fallen by more than one-third since the 1996 Census. The total number of operators has declined 10%, from 385,600 in 1996 to 346,200 in 2001. (Since 1991, farmers have been able to report up to three operators for each operation, which explains why there are more operators than the 246,900 farms in Canada.) The provinces with the largest proportion of operators under 35 were Quebec (13.7%) and Manitoba (13.4%); those with the smallest were Newfoundland and Labrador (6.4%) and British Columbia (7.9%). Aside from the decline in the number of farm operators from 1996 to 2001, particularly among the young, data on other operator characteristics released today - such as sex of farm operators, work on the farm and off, and residence on and off the farm - show trends similar to 1996. Additional profiles on the provinces, women farm operators, injuries, and farm and non-farm work are available on Statistics Canada's website (). From the Census page, choose Census of Agriculture, then Profiles of Canadian farm operators. Tables with more provincial detail about farm operators, including their median age and sex, and distribution by farm type, gross farm receipts, farm capital, farm and non-farm work and injuries, are also available. From the Canadian statistics page, choose Census of Agriculture. The third release of data in November 2003 - from the Agriculture-Population Linkage Database - will complete the portrait of Canadian agriculture that began in May. Receipts and succession significant in attracting young farmersA disproportionately high number of farms in the higher receipts category - the only class that is actually growing in number - have a young operator. For a young farmer, being the successor to an operator of an older generation may also be key to entering the sector. High capital assets, aside from making farming a possibility for young farmers through inheritance, may also be enough to lure them from the attractions of higher pay, regular hours, paid vacations and the other advantages associated with a job off the farm. One-third fewer young operatorsAnalysing the farm operator population according to three age categories - under 35 years, 35 to 54, and 55 and over - shows clear trends. Although all three have declined in number since the 1996 Census, the change in the youngest group (which includes operators from 15 years of age to 34) is dramatic and casts an increasingly large and grey shadow over farming's future. From 1996 to 2001, the number of operators under 35 decreased 35%. Since 1991, operators in this age group have dropped by almost half. 
Another way to look at the whole picture is to consider the shares held by each age group. As the share of the youngest group shrinks from census to census, the two older groups become relatively larger: nearly 54% are now between the ages of 35 and 54, and those 55 and over represent 35%. The youngest group represents about one-tenth of all farmers; in 1991, it represented one-fifth. Whether the picture is viewed in absolute or relative terms, farm operators are a greying population. The labour force contextIn the general labour force, the group most comparable to farm operators is self-employed workers. This group shows different patterns in age from farmers, and they are particularly striking at opposite ends of the scale. Younger workers represent nearly 20% of all self-employed workers, compared with 12% of farmers. For the oldest group, the relative proportions are 21% for self-employed workers and almost 35% for farmers. 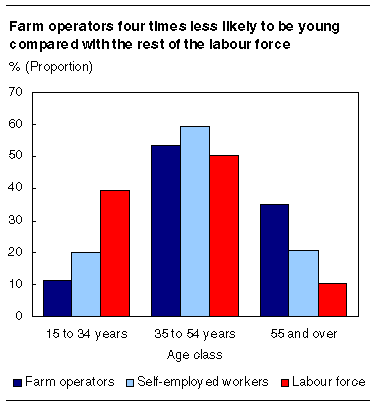
The difference in the median age - the point at which half the designated population is older and half is younger - for the two groups is also stark: for the farm operator population, the median age is 49 years; for the comparable labour force population of self-employed workers, it is 44 years. For the entire labour force, it is 38. Of all the farm operators counted on May 15, 2001, 15% were 65 or over. Another 68,000, or 20%, will celebrate their 65th birthday by 2011. In contrast, only 9% of the entire labour force will turn 65 by the 2011 Census. These figures bring up a critical question: To whom and how will agriculture's assets be transferred in the next generation? High-receipts farms have younger farmersOn average, farmers in the higher receipts classes are younger. In fact, their numbers in the receipts classes over $250,000 are large enough to lower the median age to 46 years, the lowest median age of all receipts classes. Only 11% of older operators are in the receipts classes over $250,000. In each of the other two age groups, the proportion is about 20%. Almost 75% of farm operators 55 and older reported receipts under $100,000. These older farmers in the under-$100,000 class accounted for only 26% of all operators. In each of the other two age groups, about 60% of operators fall in that receipts class. 
Another phenomenon of rising receipts is the decrease in the proportion of operators that work at non-farm jobs. By the time receipts top $250,000, the proportion has dwindled to less than 19%, compared with 45% for all operators. Of young farmers in the over-$250,000 sales class, only 23% have non-farm jobs. In classes under $250,000, 64% of young operators work at non-farm jobs. Young farmers split evenly among sole, single-generation and multiple-generation operationsAlmost 36% of young farmers are operating a farm on their own. The other two-thirds are split between same-generation (39%) and multiple-generation (25%) operating arrangements. (Operators must have at least 20 years difference in age but not necessarily be related to be considered of a different generation.) Still, 92% of all farms have one or more operators over the age of 35. 
Young farmers do not show a preference for any particular farm type (determined by the commodity that accounts for at least half of a farm's gross receipts). In fact, although the ranking differs from group to group, the three most popular farm types for all age groups are cattle, small grain and dairy farms. Young farmers do not appear to be a driving force behind the trend to no-till and conservation tillage practices. Farms with a young operator have a slight edge in no-till use, but lag slightly in their adoption of conservation tillage; in both cases, the differences from farms where their older colleagues predominate are minimal. Most multiple-generation farms include a young operatorMultiple-generation operating arrangements appear on 7% of all farms and, within that group, over 56% include a young farmer. One-third of all farms with operators from multiple generations have gross receipts of $250,000 or more; about one-quarter of operators on these high-receipts farms are young. Only 14% of all farms have gross receipts over $250,000. Multiple-generation farms also have the best expenses-to-receipts ratio (83 cents for every dollar in receipts), although the presence of a young operator appears to have no influence. Farming carries a hefty investmentStart-up costs for farmers are high compared with some other self-employed workers. A business such as a retail franchise may require considerable investment; others can start with as little as a telephone and a computer. But farming tends to require significant capital investment - in land, machinery, quota, buildings or livestock - with the average nearing $800,000 and rising to $1.4 million for a farm type such as hog or $1.1 million for dairy. 
Multiple-generation farms are also more likely to have high capital investments. Some 44% of multiple-generation farms have over $1 million in capital investments; for all other farms, the proportion is only 20%. For a young person who wants to farm, the most realistic way to a farming career may be through inheritance or another financially favourable relationship. Today's release adds another dimension to the portrait of Canadian agriculture by showing who is minding Canada's farms. The third release from the 2001 Census of Agriculture in November 2003 will give the final strokes, by showing who will be minding Canada's farms in the foreseeable future. Information on methods and data quality available in the Integrated Meta Data Base: survey number 3438. Data on farm operators at the county, regional municipality and regional district level (or their equivalents) are now available in Farm operator data: Initial release (95F0355XIE, free) on Statistics Canada's website (). From the Our products and services page, under Browse our Internet publications, choose Free, then Agriculture. For more information, or to enquire about the concepts, methods or data quality of this release, contact Gaye Ward (613-951-3172), Agriculture Division, or Media Relations (613-951-4636), Communications Division.
| |||||||||||||||||||||||||||||||||||||||||||||||||||||||||||||||

|
|

